
17–28
Dataset · 45 games · 3,042 FGA|All teams · 357 games tracked
All teams · 357 games tracked
Scoreboard tracks the process
Offense-led SQ
Edge comes from shot creation more than defensive suppression — 3rd in expected pts per attempt (1.03) while opponent look quality ranks 12th of 15. Opponents finish +0.02 expected pts per shot above their season norm in this sample.
17–28 with 25/45 SQ wins — getting the better looks more often than the scoreboard (+0.2 avg edge, +1.2 finishing). 29.5 3PA/game (2nd of 15) defines the offense — 34% of attempts from above-break threes.
- Worse looks
- 8–12 · +1.5 finishing · -7.5 edge
- Better looks
- 9–16 · +0.9 finishing · +6.4 edge
League rank · SQ wins 6th of 15 · avg edge 6th of 15 · making 8th of 15 · off xP/F 3rd of 15 · def xP/g 8th of 15 · opp-adj 12th of 15 · FG 5th of 15 (ESPN) · 3PA/g 1st of 15 · 3PM/g 2nd of 15
Won despite worse looks
Scoreboard wins where the opponent had better shot locations in our model.
+4 more in game log.
Lost despite better looks
Losses where this team got the cleaner offense but not enough makes.
+12 more in game log.
Season stats use 45 tracked team games (May 1–Oct 24, 2026) from 357 league-wide — not the complete WNBA schedule. Totals refresh as games finalize. SQ wins count games where this team got the better looks; they can differ from W–L.
Public ESPN shot data only — no defender distance or contested-shot tracking. Expected value uses location, player zone history, and shot clock, not how open the shooter was. Methodology
Season shot diet
Where Portland shoots across the tracked season — share of attempts by zone and finishing within each area.
Home away defense
Opponent shot quality allowed when this team plays at home vs on the road — same tracked FGA model as season defense.
23 home / 22 away tracked. Schedule and travel can move these numbers — compare to full-season def rows above.
Defensive process
ESPN box-score process on tracked games — turnovers forced, second chances allowed, free throws conceded, plus steals and blocks. Complements FGA-only def rows above.
Opp TO rank 3rd of 1545 tracked games with box scores. Complements FGA-only defense rows — not part of SQ wins or opponent-adjusted shot quality.
Full process edge
Full process edge per game — expected points from shots and finishing plus free throws, turnover cost, and second-chance value. Positive means this team won the overall process battle more often than not.
-7.7 · rank 12th of 1545 tracked games with box scores. Compare to SQ edge above — divergence means free throws, turnovers, or second chances carried the story.
Roster stats
Tap a player for the full zone profile.Season looks and finishing by player. Tap a row for the full zone profile.
 Megan Gustafson 209/380 FG | 41 | 380 | 40% good | 1.09 | +56.3 |
 Bridget Carleton 198/489 FG | 41 | 489 | 19% good | 0.98 | +28.9 |
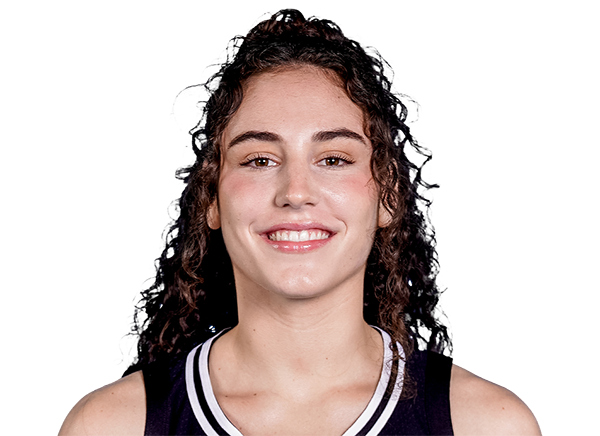 Carla Leite 191/413 FG | 39 | 413 | 32% good | 0.95 | +28.0 |
 Sarah Ashlee Barker 108/215 FG | 26 | 215 | 45% good | 1.07 | +23.0 |
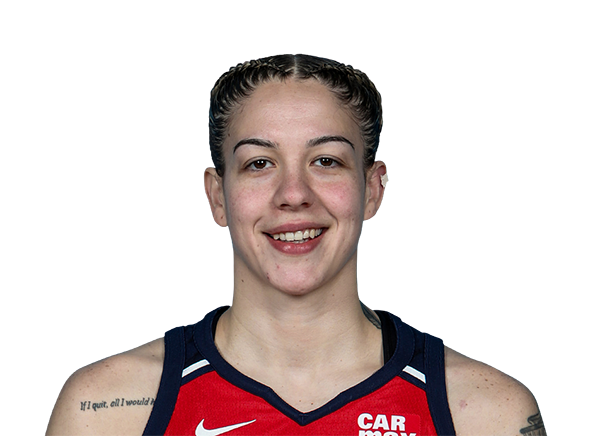 Emily Engstler 167/359 FG | 44 | 359 | 37% good | 1.04 | +18.0 |
 Serah Williams 70/129 FG | 36 | 129 | 63% good | 1.03 | +8.7 |
 Player 4068346 5/10 FG | 2 | 10 | 10% good | 0.94 | +4.6 |
 Player 4433293 9/19 FG | 3 | 19 | 37% good | 1.06 | +2.9 |
 Teja Oblak 63/151 FG | 29 | 151 | 26% good | 0.97 | +1.7 |
 Player 3142242 9/21 FG | 4 | 21 | 57% good | 1.17 | -1.5 |
 Jordan Harrison 29/69 FG | 15 | 69 | 39% good | 0.98 | -3.9 |
 Frieda Buhner 85/199 FG | 39 | 199 | 35% good | 1.07 | -9.4 |
 Holly Winterburn 42/107 FG | 27 | 107 | 22% good | 1.01 | -14.4 |
 Karlie Samuelson 44/124 FG | 30 | 124 | 29% good | 1.10 | -17.3 |
 Luisa Geiselsoder 35/106 FG | 22 | 106 | 28% good | 1.05 | -25.6 |
 Nyadiew Puoch 72/191 FG | 39 | 191 | 58% good | 1.13 | -47.3 |
Game log
| Date | Opponent | Result | Shot selection | Shot making |
|---|---|---|---|---|
| Sep 22 |  vs GSV | W90–82 | +7.3 | -4.7 |
| Sep 20 |  @ LA | L84–105 | +3.7 | -7.3 |
| Sep 18 | @ GSV | L66–82 | -11.0 | -10.8 |
| Sep 17 |  vs PHX | L91–94 | +7.8 | +6.4 |
| Aug 30 | vs GSV | L69–86 | +0.0 | -3.4 |
| Aug 28 |  @ ATL | W101–83 | -8.0 | +18.4 |
| Aug 25 |  @ DAL | L78–96 | +3.5 | -8.9 |
| Aug 23 |  vs WAS | L100–105 | +8.8 | +11.3 |
| Aug 21 |  @ TOR | L79–82 | +13.4 | -9.7 |
| Aug 16 | @ PHX | W88–85 | +7.4 | +1.2 |
| Aug 14 |  @ SEA | W84–82 | -8.4 | -3.0 |
| Aug 12 |  vs MIN | L81–85 | +5.3 | +1.7 |
| Aug 8 | vs SEA | W100–93 | +3.0 | +13.5 |
| Aug 6 | vs TOR | W97–83 | -6.0 | +10.1 |
| Aug 2 | vs LA | L101–106 | +3.1 | +3.8 |
| Jul 31 |  vs IND | L98–112 | +3.3 | +12.7 |
| Jul 28 |  @ LV | L83–98 | +12.0 | -4.0 |
| Jul 22 | vs DAL | L97–101 | -9.4 | +22.5 |
| Jul 18 | @ MIN | L93–101 | +2.3 | +2.9 |
| Jul 16 | @ WAS | W75–56 | +5.8 | -1.2 |
| Jul 14 |  @ CONN | L87–90 | -6.4 | +3.8 |
| Jul 11 | @ ATL | W102–92 | -18.4 | +19.9 |
| Jul 9 | vs LV | L80–88 | +0.4 | +4.2 |
| Jul 4 | @ SEA | W77–72 | -1.7 | -15.8 |
| Jun 28 | @ WAS | L123–124 | -1.4 | +8.7 |
| Jun 26 |  @ CHI | L94–124 | +11.1 | -12.5 |
| Jun 24 | @ CHI | L78–101 | +1.5 | -12.9 |
| Jun 17 | vs SEA | W94–89 | +9.7 | -1.9 |
| Jun 15 | @ MIN | L74–107 | -11.3 | -5.7 |
| Jun 13 | vs DAL | W84–83 | -7.8 | +9.1 |
| Jun 11 | vs LV | L89–105 | +0.8 | +9.4 |
| Jun 7 | @ LA | L72–89 | -2.0 | -21.8 |
| Jun 5 | vs PHX | L72–78 | -3.3 | +1.6 |
| Jun 2 | @ GSV | L77–95 | -13.7 | +4.2 |
| May 30 | vs IND | W100–84 | +10.7 | +14.1 |
| May 29 | vs ATL | L66–86 | -11.4 | +0.3 |
| May 27 | vs CONN | W71–61 | -10.6 | +2.2 |
| May 25 |  @ NY | W81–74 | +22.5 | -7.0 |
| May 23 | @ TOR | W99–80 | +7.7 | +5.7 |
| May 20 | @ IND | L73–90 | -5.0 | -6.9 |
| May 18 | vs CONN | W83–82 | -0.6 | +0.1 |
| May 14 | vs NY | L82–100 | -2.8 | -3.1 |
| May 12 | vs NY | W98–96 | +5.5 | +15.2 |
| May 9 | vs CHI | L83–98 | +2.6 | -5.5 |
| May 3 | vs LA | L75–85 | -11.4 | -3.3 |