This game · 135 FGA|Season model · 357 games · 48,742 shots
Indiana Fever won on finishing, not shot quality.
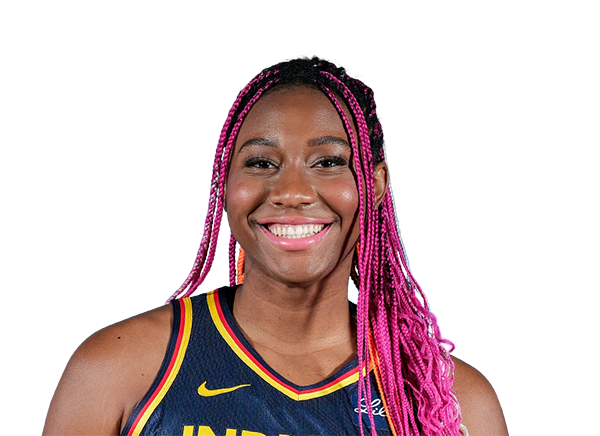
led the way with 17 points on 7-for-9 (78%), headlined by 5-for-6 at the rim — 4.5 more than expected overall with 78% of attempts from the rim or corner, with Caitlin Clark close behind (+3.5 on 27 points).
- Minnesota Lynx created 6.0 more expected points from field-goal attempts.
- Indiana Fever outperformed expected value by 6.2 points on makes and misses.
- Q2 swung the look battle — Minnesota Lynx built a +4.0 expected-point edge in that period.
Shot quality
Shot diet
Indiana Fever got the cleaner diet — 40% rim or corner looks vs 22% for Minnesota Lynx.
carried the offense at the rim — 5/6 in the restricted area.
This is where the shot diets diverged most — 15% of Minnesota's attempts came from the rim vs 32% of Indiana's, with Indiana leaning on the higher-value zone (32% vs 15%).


This is where the shot diets diverged most — 15% of Minnesota's attempts came from the rim vs 32% of Indiana's, with Indiana leaning on the higher-value zone (32% vs 15%).



Possession context
IND ran more early offense in this game.
Indiana Fever got 37% of FGA in transition (1.04 expected pts/att) vs 18% for Minnesota Lynx (0.94 expected pts/att).
Inferred from ESPN play-by-play — transition, steals, and offensive rebounds before each FGA. Not official possession tracking.
Process scorecard
Full process edge
Indiana Fever won by 27.9 pts — SQ edge said MIN.
Minnesota Lynx got the better looks, but Indiana Fever won the full process battle by 27.9 pts.
Process edge blends expected points from shots, finishing, free throws, turnover cost, and second-chance value — not just who found the better offense.
Tracked FGA
ESPN box score
Process value (pts)
Process total = expected pts from shots + finishing + free throws − turnover cost + second-chance value (1.05 expected pts per OReb). SQ edge alone ignores the last three terms.
Player shots
Key insightClark's strongest zone was Above — 43% from Above (3/7) vs. a 34% expectation.
Expected value is an estimate from public shot data — location, shooter history, and shot clock. No defender distance, closeout speed, spacing, or proprietary tracking.
Learn how it works →